Constructing Data Displays
Monday 27th November
Learning Intention: We are learning to construct data displays.
Success Criteria: I can pose and refine questions to collect data, by observation or survey, and create an appropriate graph to represent the data collected.
Learning Intention: We are learning to construct data displays.
Success Criteria: I can pose and refine questions to collect data, by observation or survey, and create an appropriate graph to represent the data collected.
Warm up: Work with a friend to discuss and
Whole class: How to use a tally in a frequency table to record data.
Independent task:
1. Decide what type of data you would like to collect (no favourite sports, pets or icecream flavours! Be creative.)
2. Create a frequency table to record your data
3. Start gathering your data!
Once you have gathered your data, decide what type of graph would be best. Watch the Maths Online video about your type of data display:
Picture Graphs 2550
Column Graphs 2554
Line Graphs 2660
Stem and Leaf Plot 4327
Pie Graph 3335
Whole class:
1. Work through some of these questions focusing on misleading data as a whole class and discuss.
2. As a class go through this Scootle Activity which looks at identifying data and making sure the graph is a correct representation.
Discuss with students how sometimes in the media data may not be represented correctly and this is done to ‘trick’ people into believing things that aren’t true. That’s why our knowledge of reading graphs is so important!
Independent task: Use grid books to construct your graph. Refer back to the quick reference guide introduced in the previous lesson.
Once you finish completing their graph you need to create 3 questions about your graph for a partner to solve.
Finished? Choose:
- Answer these questions, to practice choosing an appropriate type of graph for different types of data.
- Experiment with Google Sheets on your iPads or Excel on a laptop, to graph your data in different ways.
Interpreting Data
Tuesday 28th November
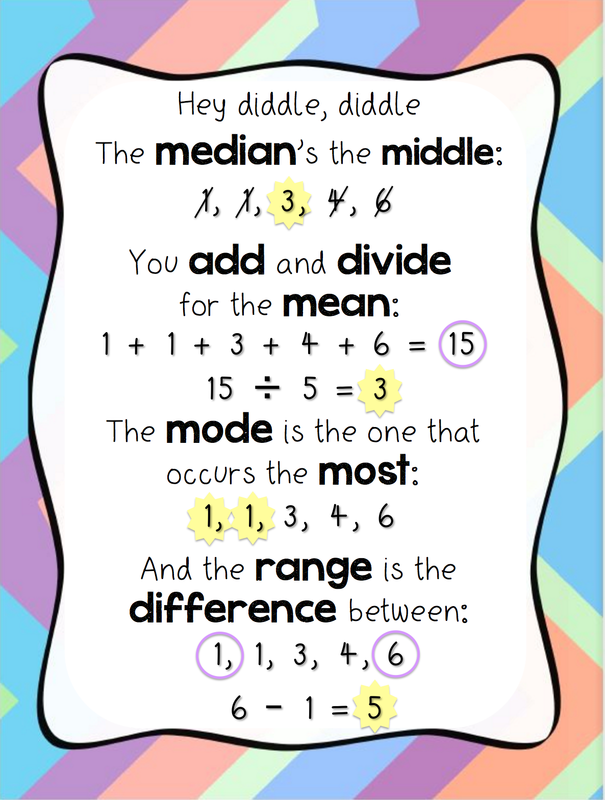
Learning Intention: We are learning to calculate mean, median, mode and range for sets of data.
Success Criteria: I can explain what the mean, median, mode and range are, and how to calculate them.
Learning Intention: We are learning to calculate mean, median, mode and range for sets of data.
Success Criteria: I can explain what the mean, median, mode and range are, and how to calculate them.
You need to rule up a page in your Maths book to record rules and examples for finding the mean, median, mode & range.
Make sets of data using between 5 and 8 playing cards, then calculate the median, mode, range, mean.
(NB: there may not be a mode, if there are no double ups of numbers!)
In pairs:
Alyssa & Lachlan
Tom & Ellenor
Kya & Ashlee
Curtis & Tom
Tahlia & Molly
With Miss Brown: Nakita, Suzhanna, Busa, Abigail, Erika,
Brock, Grace, Logan,Maddie, Grady, Farhana, Kirsten, Ryan:
Work through these graphic organisers ( printed ) which guide you through the process of solving problems relating to mean, median, mode and range. They increase in difficulty, so start with number 1 and do them in order.
After recess: Manga High Interactives:
Mean
Median
Range
Mode
Range and Mode
Comparing types of graphs
Thursday 23rd November
LI: We are determining which data displays would be best for different types of data
SC: I can explain which types of graph would be appropriate for examples of data.
LI: We are determining which data displays would be best for different types of data
SC: I can explain which types of graph would be appropriate for examples of data.
Scroll to the bottom of this page and have a go at the "exercises" (questions) in the grey boxes. Discuss with a partner which type of graph you think would be best for that data. (NB: you need to only enter a one word answer: circle, line or bar).
Types of Data Displays
Monday 13th November
Learning Intention: We are learning to describe and Interpret different sets of data in the form of different types of graphs.
Success Criteria: I can read and interpret different types of graphs.
Learning Intention: We are learning to describe and Interpret different sets of data in the form of different types of graphs.
Success Criteria: I can read and interpret different types of graphs.
Types of graphs:
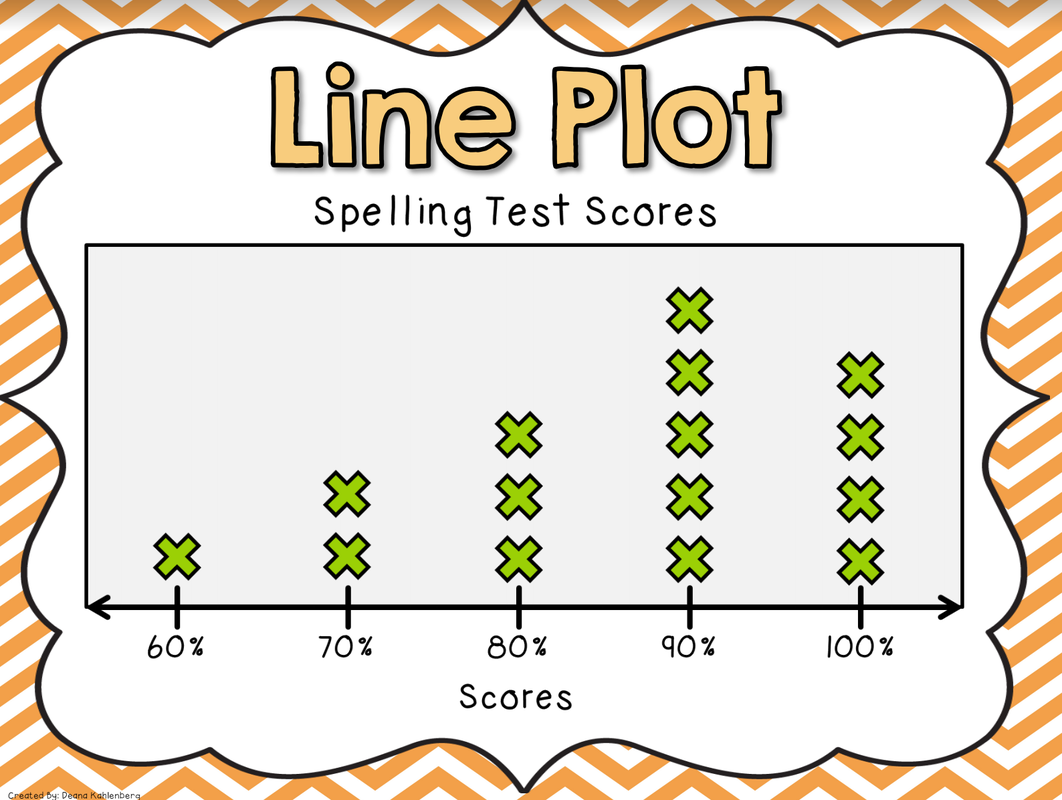
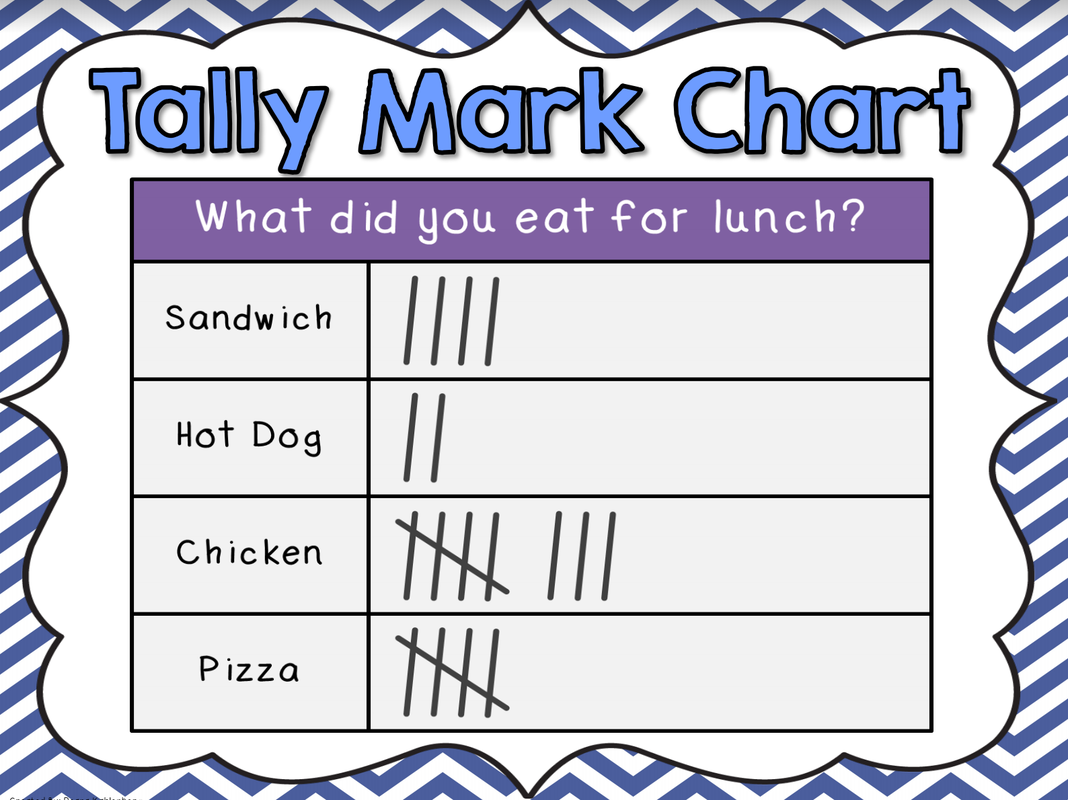
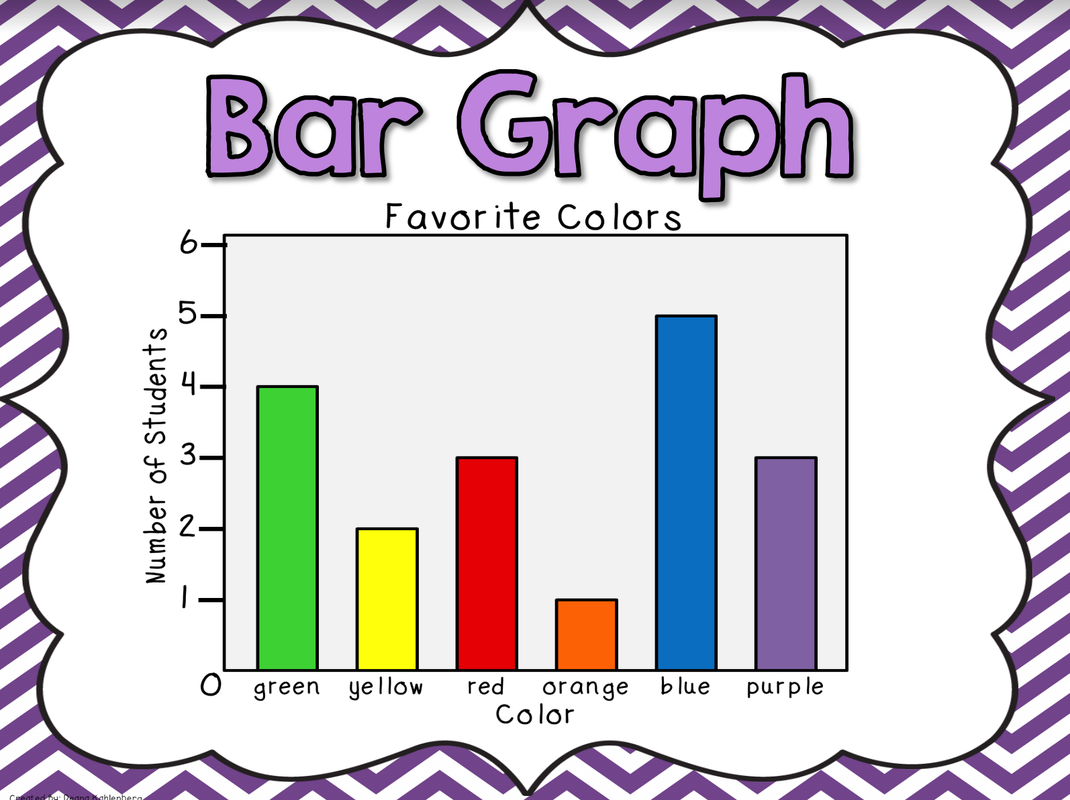
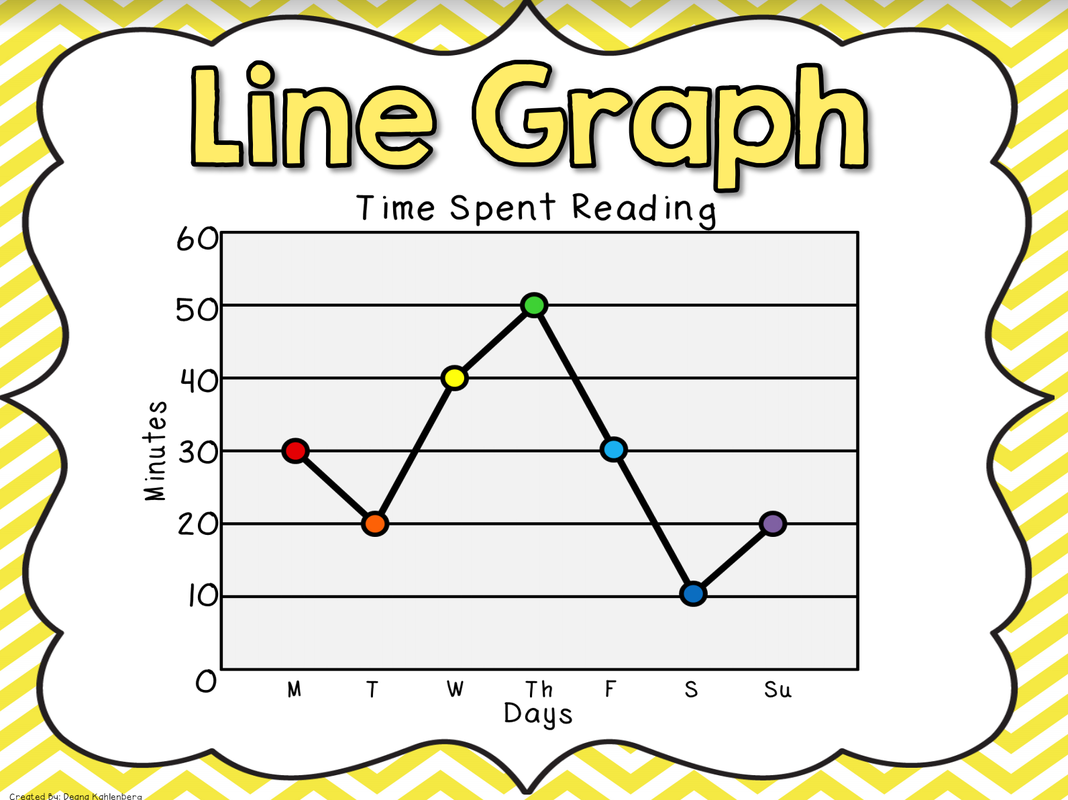
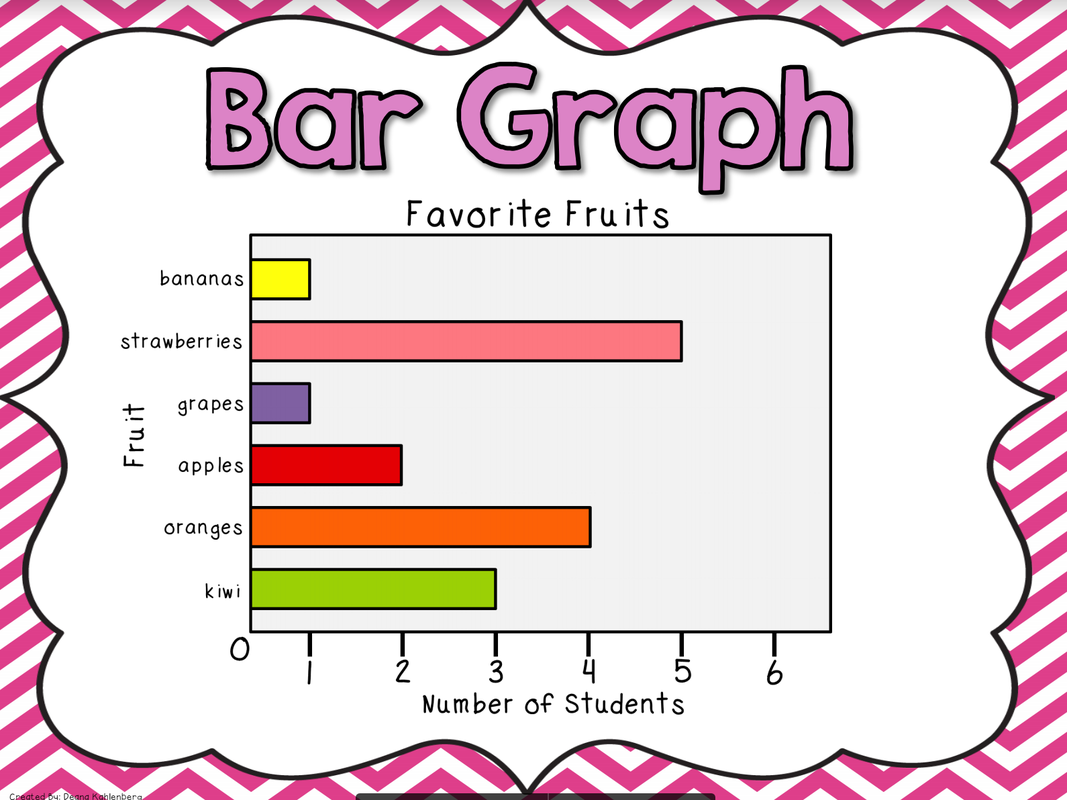
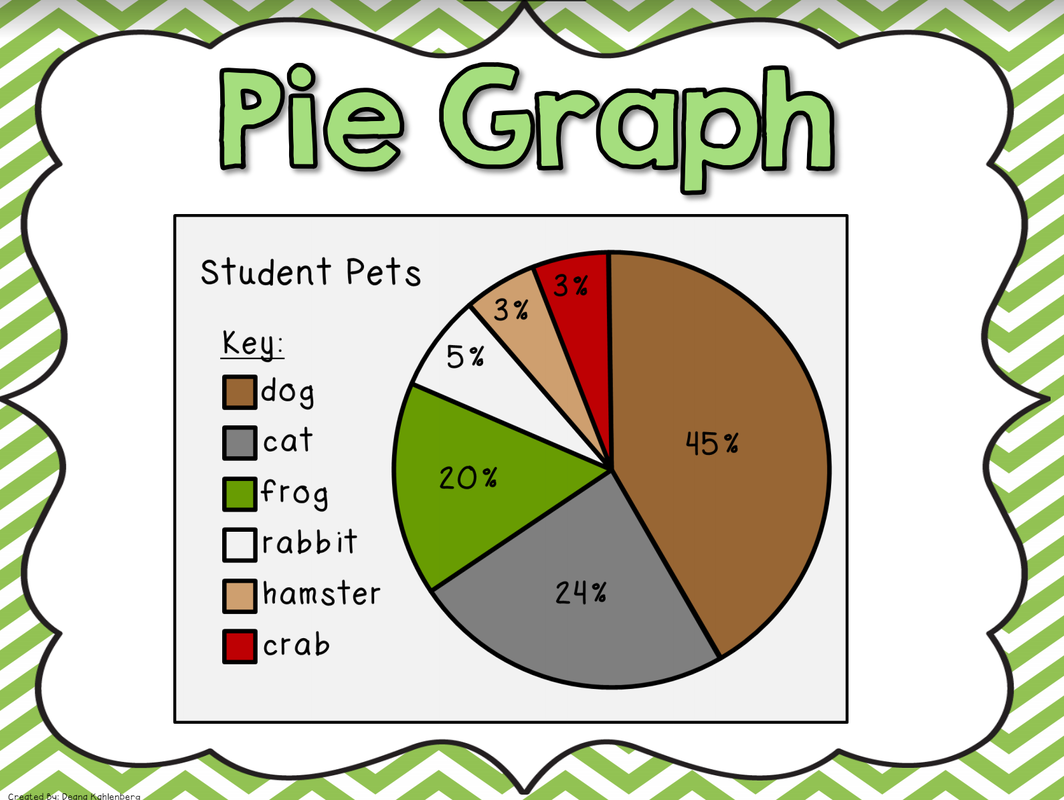
Features of graphs:
Interpreting Graphs Task Cards:
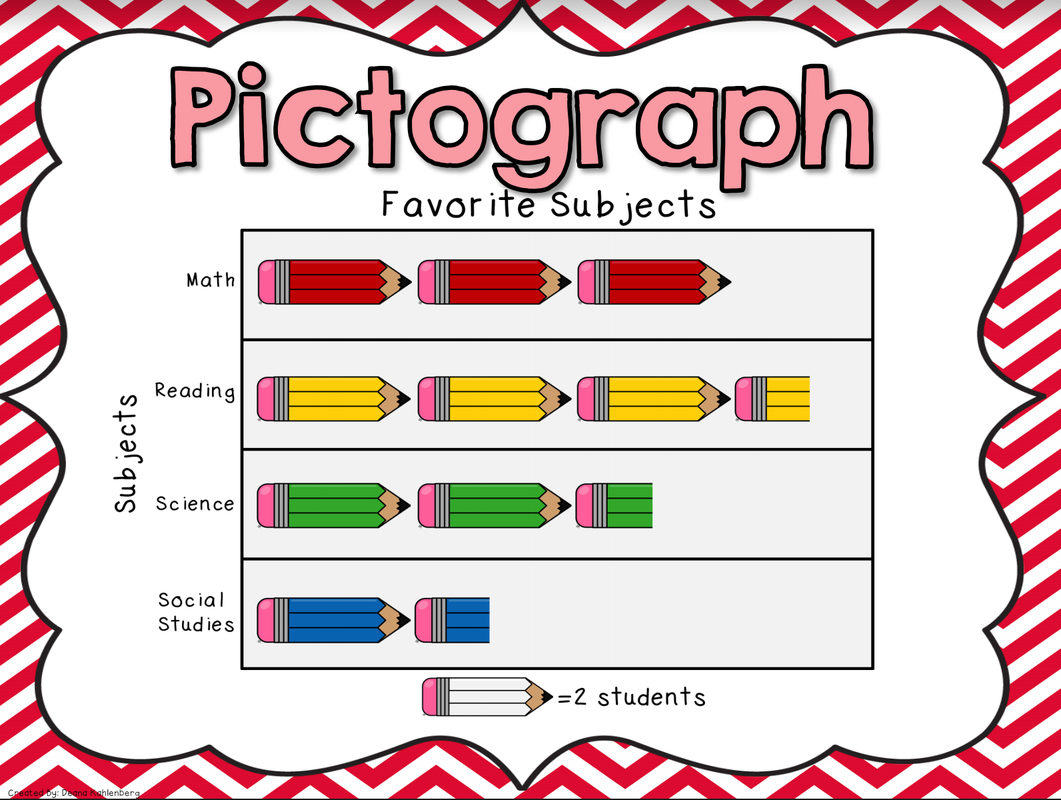
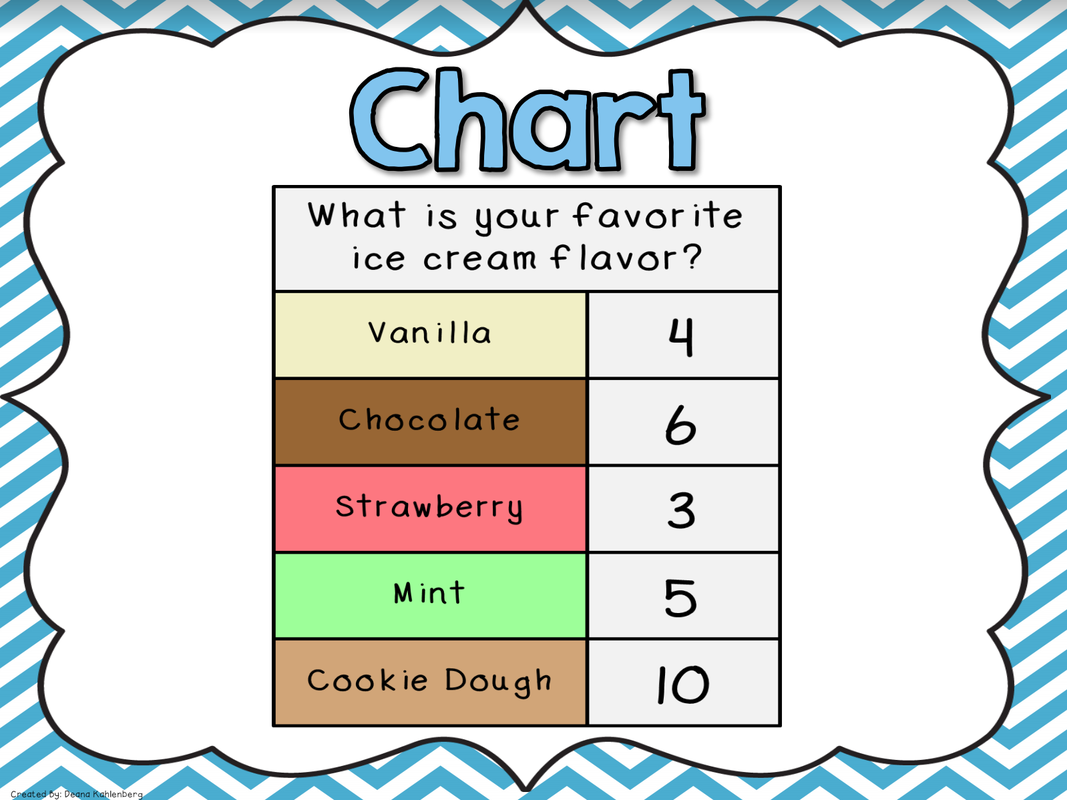
Tallies, tables, bar graphs & pictographs
Dot plots, line graphs, pie charts
Answers
Tuesday 14th November
Learning Intention: We are learning to describe and Interpret different sets of data in the form of different types of graphs.
Success Criteria: I can read and interpret stem and leaf plots.
Learning Intention: We are learning to describe and Interpret different sets of data in the form of different types of graphs.
Success Criteria: I can read and interpret stem and leaf plots.
Stem & Leaf Plots:

|
|
Wednesday 15th November
Learning Intention: We are learning to describe and interpret different types of graphs.
Success Criteria: I can read and interpret different types of graphs.
Learning Intention: We are learning to describe and interpret different types of graphs.
Success Criteria: I can read and interpret different types of graphs.
Manga High Interactives: Go through the "Teach Me" section first to make sure you are confident, then have a go at the questions.
Pictograms
Tables
Bar Charts
Line Graphs
PIe Charts
Stem & Leaf
Pictograms
Tables
Bar Charts
Line Graphs
PIe Charts
Stem & Leaf
Pie Charts: Work through this document together
Chance Games
Tuesday 7th November
Learning Intention: We are learning to identify what makes a successful game.
Success Criteria: I can identify the probability of different outcomes in a game, and evaluate the success of the game for participants and game organiser.
Partner game: Win at the Fair!
Busa & Grace
Logan & Ashlee
Suzhanna & Farhana
Tahlia & Jack
Abby & Brock
Ellenor & Grady
Kirsten & Tom
Nakita & Curtis & Ryan
Molly & Erika
Alyssa & Lachlan
Kya & Maddie
After playing for a while, stop to discuss: The cost to play this game is $1. Is the school fete actually making money by playing this game? Or are they losing money?
Whole class discussion:
Think about why this game may not be feasible.
What would you change to make it a better game? One that people want to play, and where they have a chance at winning, but that is also a fundraiser for the fete!
Tuesday 7th November
Learning Intention: We are learning to identify what makes a successful game.
Success Criteria: I can identify the probability of different outcomes in a game, and evaluate the success of the game for participants and game organiser.
You are going to work with a partner to create your own "Win at the Fair" board game. You can change any of the variables (cost to play, direction of dice and numbers, and prize money).
You need to demonstrate the game a minimum of 5 times (by creating a record sheet to keep a tally - this could be similar to yesterday's or a new design). You can re-assess your decisions and make changes as needed.
Be prepared to share and justify why your game is more successful than the original.
Statistics & Probability Mid-Test - Essential Assessment
Whole class discussion:
- Which amount did you win most often?
- Which amount has been won most often by all players in the class?
- Which amount is the most likely to win? WHY?
- Why do you think the largest prize has been placed where it is?
Think about why this game may not be feasible.
What would you change to make it a better game? One that people want to play, and where they have a chance at winning, but that is also a fundraiser for the fete!
Tuesday 7th November
Learning Intention: We are learning to identify what makes a successful game.
Success Criteria: I can identify the probability of different outcomes in a game, and evaluate the success of the game for participants and game organiser.
You are going to work with a partner to create your own "Win at the Fair" board game. You can change any of the variables (cost to play, direction of dice and numbers, and prize money).
You need to demonstrate the game a minimum of 5 times (by creating a record sheet to keep a tally - this could be similar to yesterday's or a new design). You can re-assess your decisions and make changes as needed.
Be prepared to share and justify why your game is more successful than the original.
Statistics & Probability Mid-Test - Essential Assessment
Comparing Frequencies
Monday 6th November
Learning Intention: We are learning to compare observed frequencies across experiments with expected frequencies.
Success Criteria: I can identify all outcomes of an experiment, and determine the probability of each outcome.
Learning Intention: We are learning to compare observed frequencies across experiments with expected frequencies.
Success Criteria: I can identify all outcomes of an experiment, and determine the probability of each outcome.
Whole class: Watch Maths Online 1567 - “Observed and Expected Frequencies”. Work through questions together as a class.
Partner game: Race to the Top
Busa & Logan
Suzhanna & Tahlia
Abby & Ellenor & Nakita
Molly & Ashlee
Erika & Maddie
Alyssa & Grace
Farhana & Kirsten
Curtis & Jack
Tom & Brock
Kya & Grady
Lachlan & Ryan
Partner game: Race to the Top
Busa & Logan
Suzhanna & Tahlia
Abby & Ellenor & Nakita
Molly & Ashlee
Erika & Maddie
Alyssa & Grace
Farhana & Kirsten
Curtis & Jack
Tom & Brock
Kya & Grady
Lachlan & Ryan
Chance Experiments
Wednesday 1st November
Learning Intention: We are learning to conduct chance experiments with both small and large numbers of trials.
Success Criteria: I can predict the outcome of chance experiments and then compare predicted outcomes with actual outcomes.
Learning Intention: We are learning to conduct chance experiments with both small and large numbers of trials.
Success Criteria: I can predict the outcome of chance experiments and then compare predicted outcomes with actual outcomes.
|
Warm Up: Snake
Virtual Dice I will roll the dice. You need multiply the two numbers and write the product (answer) under the S column. I will continue rolling the dice. You continue to multiply the numbers and add the product so that you have a running total under the S column. After each roll of the dice you may decide to go out of the game, and hold your score for that round. (Sit down to show you are holding your score). If you are still in and I roll a 1, you are out and your score for that round is wiped to zero. If you are still in and I roll two 1s (snake eyes), you are out and your score for the entire game is wiped to zero! Everyone is back in for the next round (in the N column). At the end of the game you add up all the points you have collected from all 5 rounds. Whoever has the highest total wins! |

|
Whole class: Work through this presentation together.
Group 1: Busa, Suzhanna, Abby, Nakita & Erika
Chance Outcomes - similar to yesterday.
Group 2: With Miss Brown: Curtis, Kya, Molly, Tahlia, Alyssa, Lachlan, Ashlee, Ellenor
Fidget spinner probability
Group 3: Chance experiments worksheet - complete with a partner. You need one coin and one six-sided die to share with your partner.
Tom & Grace
Jack & Logan
Brock & Grady
Kirsten & Maddie,
Farhana & Ryan
Finished? Go back to your task from yesterday and complete anything you didn't finish.
Then: Log on to Essential Assessment. Review your pre-assessment then work through "My Numeracy" tasks for Statistics and Probability.
Probability Vocabulary
Tuesday 24th October
Learning Intention: We are learning to understand the vocabulary associated with probability.
Success Criteria: I can use probability vocabulary when explaining the likelihood of everyday events occurring.
Learning Intention: We are learning to understand the vocabulary associated with probability.
Success Criteria: I can use probability vocabulary when explaining the likelihood of everyday events occurring.
Warm up: Four Corners
Probability: the study of the chances of an event occurring.
Whole class: Create anchor chart together, discussing everyday events and where they would be placed on the probability scale.
Co-operative group task: Create a poster listing everyday events, showing the probability of these events occurring. You must have a minimum of 6 events under each column and be able to explain WHY you believe each event should be in that column.
Share & provide feedback, focusing on using appropriate vocabulary.
Describing Probability using
fractions, decimals & percentages
Monday 30th October
Learning Intention: We are learning to describe probabilities using fractions, decimals and percentages.
Success Criteria: I can represent probability as a percentage or a fraction or decimal between 0 and 1.
Learning Intention: We are learning to describe probabilities using fractions, decimals and percentages.
Success Criteria: I can represent probability as a percentage or a fraction or decimal between 0 and 1.
Refer back to probability scale on yesterday’s anchor chart. You are going to create your own probability scale in your maths book to refer back to.

Group 1: With Miss Brown: Busa, Tahlia, Molly, Curtis, Kya, Suzhanna, Abby, Nakita & Erika
Probability
Group 2: Ashlee, Alyssa, Ellenor, Tom, Jack, Brock, Grace, Lachlan, Logan, Grady, Kirsten
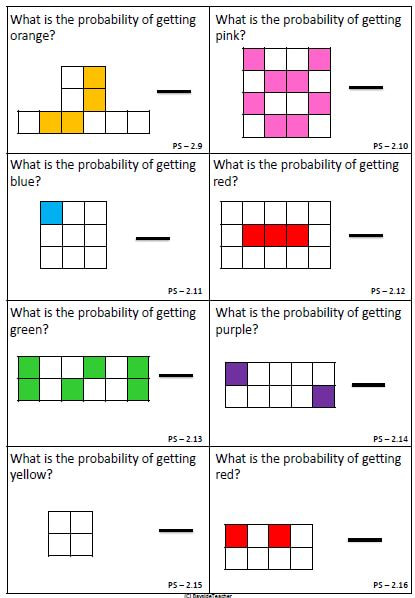
Complete the task cards below, recording the probability as a fraction, then converting to a decimal and percentage.
Complete the task cards below, recording the probability as a fraction, then converting to a decimal and percentage.
2. Do as many of these IXL questions as the website lets you:
IXL Practice - Finding the Probability
IXL practice - calculating probability of one event
3. Log on to Essential Assessment. Work through "My Numeracy" tasks for Statistics and Probability.
IXL Practice - Finding the Probability
IXL practice - calculating probability of one event
3. Log on to Essential Assessment. Work through "My Numeracy" tasks for Statistics and Probability.
Group 3: Maddie, Farhana & Ryan
Exploring Probability with Cards
Exploring Probability with Cards
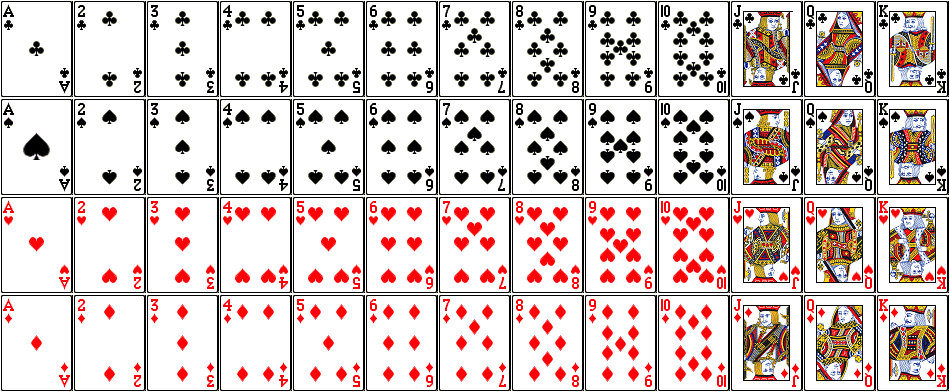
Think of all the different possibilities that could occur when you pick one card out of a pack.
For each possible outcome, record the probability as a fraction, decimal and percentage. To do this, rule up a table with four columns: Event, Probability as a Fraction, Probability as a Decimal, Probability as a Percentage.
Events: Start by determining the probability of the card being:
You need to think creatively and come up with at least five more of your own events.
If you finish, do as many of these questions as the website will let you:
Log on to Essential Assessment. Review your pre-assessment then work through "My Numeracy" tasks for Statistics and Probability.
NB: we need at least 4 fidget spinners for the next Maths lesson!
For each possible outcome, record the probability as a fraction, decimal and percentage. To do this, rule up a table with four columns: Event, Probability as a Fraction, Probability as a Decimal, Probability as a Percentage.
Events: Start by determining the probability of the card being:
- A heart
- A male (king or jack)
- An even number
- A black three
- A red Queen
You need to think creatively and come up with at least five more of your own events.
If you finish, do as many of these questions as the website will let you:
- IXL practice - calculating probability of one event
- IXL Practice - probability of opposite, mutually exclusive and overlapping events
Log on to Essential Assessment. Review your pre-assessment then work through "My Numeracy" tasks for Statistics and Probability.
NB: we need at least 4 fidget spinners for the next Maths lesson!
